Tuesday, February 9, 2021


ITIL Service Level Agreements or SLAs are recognized as an essential requirement to delivering consistent IT services to the customer community, irrespective if they are internal or external customers of the organization. What is often neglected when considering the establishment of the SLA is the corresponding necessity for the Operating Level Agreements or OLAs. ITIL pays little attention or guidance to the production of OLAs, caring to focus more on the production of the SLA.
 
ITIL Service Level Management or SLM is a critical component of every IT organization delivering services, but underpinning the success of the SLA it is imperative that the IT organization or department works collectively to deliver and support the IT services to the customer base as defined within the ITIL Service Catalogue. The OLA ensures that each department's role and responsibilities and interactions with each of the other teams, groups and suppliers within the IT department are formalized, documented, and agreed to.
 
The OLA and SLA work 'hand in glove' and ensure a consistent understanding throughout the IT organization, furthermore, the new-comer to the department is able to 'come up to speed' quicker and therefore be more effective in the manor in which the team, group, and department operate - leaving little to chance. As a 'living document' it should be updated on a regular basis to ensure it remains effective and where possible it should be published on the organizations' intranet.
 
Probably one of the best examples as to where the OLA is most effective is when it explains the response time of the IT support teams to the various 'severities' assigned to Incidents. The response time stated in the OLA should be less than that stipulated in the SLA and as agreed with the customer, to ensure that IS wherever possible are able to meet its service levels.
 

In summary, the Service Level Agreement is customer-facing and supports the services offered by the IT department. The Operating Level Agreement permits the various teams, groups, and suppliers to work cohesively together to deliver the IT services in support of the SLA.

Service Level Agreements (SLAs) defining the quality attributes (QoS - Quality of Service) and guarantees a service is required to process, are of growing commercial interest with a deep impact on the strategic and organizational processes, as many research studies and intensified interest in accepted management standards like ITIL v4 show. They are used in all areas of IT reaching from hosting or communication services to help desk or problem resolution. A well-defined and effective SLA correctly fulfills the expectations of all participants and provides metrics for accurately measuring performance to the guaranteed Service Level (SL) objectives. During the monitoring and enforcement phase, the defined metrics will be used to detect violations to the promised SLs and to derive consequential activities in terms of rights and obligations. They play a key role in metering, accounting and reporting and provide data for further analysis and refinement of SLAs in the analysis phase. SLA metrics are defined from a variety of disciplines, such as business process management, service and application management, or traditional systems and network management. 

Different organizations have different definitions for crucial IT parameters such as Availability, Throughput, Downtime, Response Time, etc, for example some focus on the infrastructure (TCP connections) to define service availability, while others refer to the service application (ability to access the service application). Ambiguity, unfulfilled expectations and problems during the accomplishment of SLAs are the result. A poor choice of metrics will result in SLAs that are difficult to enforce automatically and may motivate the wrong behaviour. Currently, practitioners have almost no support in selecting the appropriate metrics for the implementation of successful SLAs (in terms of automation and compliance with the service objects and IT management processes) in order to automatically gauge the service performance. The paper does not attempt to define an exhaustive list of metrics that should be included in a SLA - the topic is too large by the enormous number of potential metrics and it varies as seen before from organization to organization and service to service. We propose a general categorisation scheme for typical metrics for basic service objects and IT management processes and populate it with metrics which commonly appear in SLAs. The metrics are derived from industrial requirements, i.e. they are taken from SLAs currently in use in an effort to provide realistic terms that are both useful and usable in particular for the automation of SLAs. To our knowledge, this is a first-of-a-kind approach and a multi-dimensional categorization of SLA contents and metrics is missing in literature. The contribution of the categorization is manifold. It supports SLA engineers in their design decision in particular concerning the specification of SLAs which are intended to be monitored and enforced automatically. During execution time it might contribute in root causes analysis identifying problems such as infrastructure instability, low-performance levels of service objects or poorly designed, critical IT processes for which responsible persons can be derived. Furthermore, it might be used to analyse existing SLAs indicating the extent to which an SLA is already oriented towards ITIL and if there is improvement potential.


Service Level Agreements This section gives an insight into Service Level Agreements and in general IT service contracts. It categorizes different types of service contracts, presents the main component parts and defines the goals in order to reach a common understanding. We first start with the definition of some terms used throughout the paper: • SLA metrics are used to measure the performance characteristics of the service objects. They are either retrieved directly from the managed resources such as servers, middleware or instrumented applications or are created by aggregating such direct metrics into higher-level composite metrics. Typical examples of direct metrics are the MIB variables of the IETF Structure of Management Information (SMI) such as number of invocations, system uptime, outage period or technical network performance metrics such as loss, delay, utilization etc. which are collected via measurement directives such as management interfaces, protocol messages, URIs etc. Composite metrics use a specific function averaging one or more metrics over a specific amount of time, e.g. average availability, or breaking them down according to certain criteria, e.g. maximum response time, minimum throughput, top 5%, etc. • Service Levels and Guarantees a.k.a. SLA rules represent the promises and guarantees with respect to graduated high/low ranges, e.g., average availability range [low: 95% , high: 99%, median: 97%], so that it can be evaluated whether the measured metrics exceed, meet or fall below the defined service levels at a certain time point or in a certain validity period. They can be informally represented as if-then rules which might be chained in order to form graduations, complex policies, and conditional guarantees, e.g., conditional rights and obligation with exceptions, violations, and consequential actions: “If the average service availability during on month is below 95% then the service the provider is obliged to pay a penalty of 20%.”. • IT Management Processes / ITIL Processes are IT management processes defining common practices in areas such as Incident, Problem, Configuration, Change or Service Level Management. • SLA (Service Level Agreement): An SLA is a document that describes the performance criteria a provider promises to meet while delivering a service. It typically also sets out the remedial actions and any penalties that will take effect if performance falls below the promised standard. It is an essential component of the legal contract between a service consumer and the provider. According to the Hurwitz Group the life cycle of an SLA is defined as follows: 28 The objectives of SLAs are manifold. In a nutshell, the substantial goals are: [Pa04] • Verifiable, objective agreements • Know risk distribution • Trust and reduction of opportunistic behavior • Fixed rights and obligations • Support of short and long term planning and further SLM processes • Decision Support: Quality signal (e.g. assessment of the new market participants) According to their intended purpose, their scope of application or their versatility SLAs can be grouped into different (contract) categories, e.g. Table 1: SLA categorization Intended Purpose Basic Agreement Defines the general framework for the contractual relationship and is the basis for all subsequent SLAs inclusive the severability clause. Service Agreement Subsumes all components which apply to several subordinated SLAs. Service Level Agreement Normal Service Level Agreement Operation Level Agreement (OLA) A contract with internal operational partners, which are needed to fulfill a superior SLA. Underpinning Contract (UC) A contract with an external operational partner, which are needed to fulfill a superior SLA. Scope of Application (according to Internal Agreement Rather an informal agreement than a legal contract In-House Agreement Between internal department or divisions External Agreement Between the service provider and an external service consumer Multi-tiered Agreement Including third parties up to a multitude of parties 1. SLA Design 2. Assign SLA owner 3. Monitor SLA compliance 4. Collect and analyze data 5. Improve the service provided 6. Refine SLA Fig. 1 SLA life cycle [St00] 29 Versatility (according to [Bi01]) Standard Agreement Standard contract without special agreements Extensible Agreement Standard contract with additional specific agreements Individual Agreement Customized, individual agreements Flexible Agreement Mixture of standard and individual contract A particular service contract might belong to more than one category, e.g. an Operation Level Agreement (OLA) might also be an individual in-house agreement. Several service contracts can be organized in a unitized structure according to a taxonomical hierarchy: Service Level Agreements come in several varieties and comprise differently technical, organizational or legal components. Table 2 lists some typical contents. Table 2: Categorization of SLA contents Technical Components Organizational Components Legal Components - Service Description - Service Objects - SLA/QoS Parameter - Metrics - Actions … - Liability and liability limitations - Level of escalation - Maintenance / Service periods - Monitoring and Reporting - Change Management … - Obligations to co-operate - Legal responsibilities - Proprietary rights - Modes of invoicing and payment.


 SLA Metrics In order to develop a useful categorization scheme for IT metrics, we have spoken to close to three dozen IT service providers from small-and medium-sized enterprises to big companies and we have analyzed nearly fifty state-of-the-art SLAs currently used throughout the industry in the areas of IT outsourcing, Application Service Provisioning (ASP), Hardware Hosting, Service Suppliers and many other. One of the biggest problems we identified is the lack of rapport between metrics and service objects/IT processes as well as the lack of automation in SLA management and monitoring which is directly influenced by the underlying metrics and their ability to be automated. According to this observation we use three major categories to structure the field of SLA metrics: The service objects under consideration, ITIL processes and automation grade. The first category distinguishes basic service objects such as hardware, software, network etc. Composite metrics such as end-to-end availabilities can be broken down in smaller direct metrics which are assigned to one of these basic object types. The second category is organized around the eleven ITIL management processes. This leads to clear responsibilities and procedures and the metrics might reveal potential for process optimization. The last category deals with the question of measurability and therefore implicitly with the automation of metrics. It helps to find “easy-tocollect” metrics and to identify problematic SLA rules in existing SLAs, i.e. rules with metrics which can be measured manually only or which can not be measured at all. 31 In a nutshell, each category gives answers to different questions relating to design, implementation and analysis of SLAs, such as “Which metrics can be used for a particular service object?”, “Can the metric be automatically measured and what are the possible units?” or “Does a particular SLA sufficiently support the ITIL processes or is there improvement potential in terms of missing metrics?” etc. Furthermore, the combination of the categories helps to identify dependencies between used SLA resources and the performance of management processes and management tools.


Categorization according to Service Objects Although the particular end-to-end service objects may differ considerably among SLAs, they can mostly be reduced to five basic IT object classes, namely: Hardware, Software, Network, Storage and Help Desk (a.k.a. Service Desk). The respective instances can be combined in every combination in order to form complex and compound services such as e.g. ASP solutions including servers (hardware), applications such as SAP (software), databases or data warehouse (storage) and support (help desk). Each object class has its own set of typical quality metrics. In the following we present useful metrics in each class and give examples for their units.  


Friday, April 5, 2019

Cisco ACI Guide for Humans

Cisco ACI Guide for Humans, Part 1: Physical Connectivity

First of all, I need to explain why I decided to write such a post. It's quite simple to everyone who ever tried to Deploy/Configure/Understand how Cisco ACI works using the official Cisco Documentation. Cisco ACI is a very powerful architecture, and once you learn it - you start loving it. My assumption is that for some reason, Cisco seems to have hired the App Development experts to develop the ACI GUI and the ACI design and configuration guides, and the final product turned out to be hard to digest to both, DevOps and Networking professionals. That is why I feel there is a need to explain the concepts in a way more easy to understand for us, humans.

TIP: APIC maintains an audit log for all configuration changes to the system. This means that all the changes can be easily reverted.
Before the ACI installation starts, we need to connect every ACI controller (APIC) to 2 Leafs. There should be 3 or 5 APICs, for high availability, and a standard procedure, once the cabling is done, should be:

  • Turn ON and perform a Fabric Discovery.
  • Configure Out-of-Band Management.
  • Configure the NTP Server in Fabric Policies -> POD Policies” menu. This is very important, because if the Fabric and the Controllers are in different time zones for example, the ACI wont synchronise correctly.


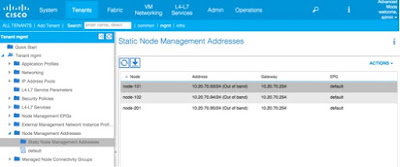
Once the Fabric Discovery is done, you need to enter the mgmt tenant, and within the Node Management Addresses create the Static Entries for all your nodes. In our case, we have 3 nodes: Spine (201) and 2 Leafs (101 and 102). This means that since the nodes are not consecutive, you should create 2 Static Entries, one for nodes 101-102, and the second one for the node 201. You should choose the “default” Node Management EPG for now, and you will end up with:


When we are looking at a real world ACI deployment, in the Typical Migration Scenario a client would want us to migrate 2 different environments:
- Virtual Environment, where we would need to first define all VM types and "group" them (define EPGs).
- Physical Environment.
Once we have the environments defined, we need to build the ANPs (Application Network Profiles), where we will group all the EPGs that need to inter-communicate.
Once we did the initial design, we need to make a list of all the tasks we need to do, and start building up the Tenants. Be sure you understand what Infra and Common tenants are before you start planning the Configuration. Configuration objects in the Common tenant are shared with all other tenants (things that affect the entire fabric):
- Private Networks (Context or VRF)
- Bridge Domains
- Subnets

1. Physical Connectivity/Fabric Policies
The communication with the outside world (external physical network) starts by a simple question: Who from the outside world needs to access the "Service" (ANP in the ACI "language"). Once we have this answered, we need to define a EPG with these users. Let´s say the financial department needs to access the ANP, which is a Salary Application. We will create the EPG called "Financial_EPG" which might be an External L2 EPG where we group all the guys from Finances. This EPG will access the Financial Application Web Server, so the Financial_Web_EPG will need a PROVIDER CONTRACT allowing the access to Financial_Department_EPG.
Domains are used to interconnect the Fabric configuration with the Policy configuration. Different domain types are created depending on how a device is connected to the leaf switch. There are four different domain types:
- Physical domains, for physical servers (no hypervisor).
- External bridged domains, for a connection to L2 Switch via dot1q trunk.
- External routed domains, for a connection to a Router/WAN Router.
- VMM domains, which are used for Hypervisor integration. 1 VMM domain per 1 vCenter Data Center.
The ACI fabric provides multiple attachment points that connect through leaf ports to various external entities such as baremetal servers, hypervisors, Layer 2 switches (for example, the Cisco UCS fabric interconnect), and Layer 3 routers (for example Cisco Nexus 7000 Series switches). These attachment points can be physical ports, port channels, or a virtual port channel (vPC) on the leaf switches.
VLANs are instantiated on leaf switches based on AEP configuration. An attachable entity profile (AEP) represents a group of external entities with similar infrastructure policy requirements. The fabric knows where the various devices in the domain live and the APIC can push the VLANs and policy where it needs to be. AEPs are configured under global policies. The infrastructure policies consist of physical interface policies, for example, Cisco Discovery Protocol (CDP), Link Layer Discovery Protocol (LLDP), maximum transmission unit (MTU), and Link Aggregation Control Protocol (LACP). A VM Management (VMM) domain automatically derives the physical interfaces policies from the interface policy groups that are associated with an AEP.
VLAN pools contain the VLANs used by the EPGs the domain will be tied to. A domain is associated to a single VLAN pool. VXLAN and multicast address pools are also configurable. VLANs are instantiated on leaf switches based on AEP configuration. Forwarding decisions are still based on contracts and the policy model, not subnets and VLANs. Different overlapping VLAN pools must not be associated with the same attachable access entity profile (AAEP).

The two types of VLAN-based pools are as follows:

  • Dynamic pools - Managed internally by the APIC to allocate VLANs for endpoint groups (EPGs). A VMware vCenter domain can associate only to a dynamic pool. This is the pool type that is required for VMM integration.
  • Static pools - The EPG has a relation to the domain, and the domain has a relation to the pool. The pool contains a range of encapsulated VLANs and VXLANs. For static EPG deployment, the user defines the interface and the encapsulation. The encapsulation must be within the range of a pool that is associated with a domain with which the EPG is associated.

An AEP provisions the VLAN pool (and associated VLANs) on the leaf. The VLANs are not actually enabled on the port. No traffic flows unless an EPG is deployed on the port. Without VLAN pool deployment using an AEP, a VLAN is not enabled on the leaf port even if an EPG is provisioned. Infrastructure VLAN is required for AVS communication to the fabric using the OpenFlex control channel.

Now that this is all clear, we can configure, for example, a Virtual Port Channel between our Leaf Switches and an external Nexus Switch. In our case, we are using the Nexus5548 (5.2). Physical Connectivity to ACI will generally be handled using the Access Policies. There is a bit non-intuitive procedure that needs to be followed here, so lets go through it together:

1.1 Create the Interface Policies you need.
You only need to create the Interface Policies if you need a Policy on the Interface that is different then the Default policy. For example, the default LLDP state is ENABLE, so if you want to enable the LLDP – just use the default policy. In this case you will most probably need only the Port-Channel Policy, because the Default Port-Channel policy enables the “ON” mode (Static Port-Channel).

1.2 Create the Switch Policy.
This is the step where you will have to choose the Physical Leaf Switches where you need to apply your Policy. In our case we will choose the both Leaf Switches (101 and 102). This is done under Switch Policies -> Policies -> Virtual Port Channel Default.

1.3 Create the Interface Policy Group.
In this step you will need to create the Group that gathers the Interface Policies you want to use on the vPC. This means that we need to create a vPC Interface Policy Group and

1.4 Create the Interface Profile.
This is the step that will let you specify on which ports the vPC will be configured. In our case we want to choose the interface e1/3 of each Leaf.

1.5 Create the Switch Profile.
Switch Profile lets you choose the exact Leaf Switches you want the policy applied on, and select the previously configured Interface Profile to specify the vPC Interfaces on each of those leaf switches.
Check if everything is in order:

Nexus# show port-channel summary

3     Po3(SU)     Eth      LACP      Eth1/17(P)   Eth1/18(P)

Leaf1# show vpc ext
Legend:
(*) - local vPC is down, forwarding via vPC peer-link

vPC domain id                     : 10
Peer status                       : peer adjacency formed ok
vPC keep-alive status             : Disabled
Configuration consistency status  : success
Per-vlan consistency status       : success
Type-2 consistency status         : success
vPC role                          : primary
Number of vPCs configured         : 1
Peer Gateway                      : Disabled
Dual-active excluded VLANs        : -
Graceful Consistency Check        : Enabled
Auto-recovery status              : Enabled (timeout = 240 seconds)
Operational Layer3 Peer           : Disabled

vPC Peer-link status
---------------------------------------------------------------------
id   Port   Status Active vlans
--   ----   ------ --------------------------------------------------
1           up     -

vPC status
---------------------------------------------------------------------------------
id   Port   Status Consistency Reason               Active vlans Bndl Grp Name
--   ----   ------ ----------- ------               ------------ ----------------
1    Po1    up     success     success              -            vPC_101_102


IMPORTANT: ID and port-channel number (Po#) are automatically created and will vary. Notice no active VLANs. They will appear once you have created and associated an AEP.
Multicast is also allowed in the ACI Fabric, the MCAST trees are built, and in the case of failure there is a FRR (Fast Re-Route). The ACI Fabric knows the MCAST tree, and drops the MCAST exactly on the ports of the leaf Switches where the MCAST frames are supposed to go.  This might be a bit confusing, when you consider that ACI actually STRIPS the encapsulation to save the Bandwidth when the frame gets to the Leaf Port (this applies to all external encapsulations: dot1x, VxLAN, nvGRE…), and adds it back on when the “exit” leaf needs to forward the frame to the external network.

2. Tenant(s) and 3. VRF are the concepts that I think are clear enough even from the official Cisco documentation, so I wont go too deep into it.

4. Bridge Domains and EPGs
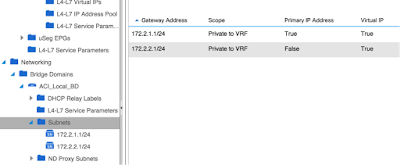
Once you create the Bridge Domain, you need to define the Subnets that will reside within the Bridge Domain. These Subnets are used as the Default Gateway within the ACI Fabric, and the Default Gateway of the Subnet is equivalent to the SVI on a Switch.
In our case we created a Bridge Domain called “ACI_Local_BD”, and decided to interconnect 2 Physical PCs with different subnets, and see if they can ping if we put them in the same EPG. In order to do this we created the following Subnets within the EPG:

  • 172.2.1.0/24 with the GW 172.2.1.1 (configured as a Private IP on ACI Fabric, and as the Principal GW within the Bridge Domain)
  • 172.2.2.0/24 with the GW 172.2.2.1 (configured as a Private IP on ACI Fabric)


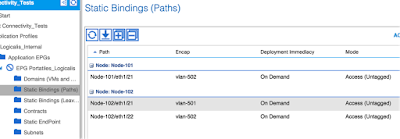
Once we have the BD and the Subnets created, we need to define the EPG(s). Since in our case we are treating the Physical Servers, we know exactly what physical port of each Leaf they are plugged to. This means that the easiest way to assign the Physical Servers to the EPG is to define the Static Bindings.

IMPORTANT: If you use the Static Bindings (Leafs), all the ports within the Leaf you configure will statically belong to the EPG.

In our case we configured the ports e1/21 and e1/22 of the Leaf1, and the port e1/21 of the Leaf 1 (Node1), as shown on the screenshot below.

TIP: In one moment you will need to manually define the encapsulation of the traffic coming from this Node within the ACI Fabric. This is not the number of the Access VLAN on the Leaf port that VLAN will be locally assigned by the Leaf. This is a VLAN that needs to be from the VLAN Pool you defined for the Physical Domain.


Now comes the “cool” part (at least for the Networking guys). We will check what is happening with the VLANs on the Leaf Switches.

Leaf2# show vlan extended

 VLAN Name                             Status    Ports
 ---- -------------------------------- --------- -------------------------------
 7    infra:default                    active    Eth1/1, Eth1/5
 8    Connectivity_Tests:ACI_Local_BD  active    Eth1/21, Eth1/22
 9    Connectivity_Tests:Logicalis_Int active    Eth1/22
      ernal:Portatiles_Logicalis
 10   Connectivity_Tests:Logicalis_Int active    Eth1/21
      ernal:Portatiles_Logicalis

 VLAN Type  Vlan-mode  Encap
 ---- ----- ---------- -------------------------------
 7    enet  CE         vxlan-16777209, vlan-4093
 8    enet  CE         vxlan-16121790
 9    enet  CE         vlan-502
 10   enet  CE         vlan-501


Leaf1# show vlan ext

 VLAN Name                             Status    Ports
 ---- -------------------------------- --------- -------------------------------
 7    infra:default                    active    Eth1/1, Eth1/5
 10   Connectivity_Tests:ACI_Local_BD  active    Eth1/21
 11   Connectivity_Tests:Logicalis_Int active    Eth1/21
      ernal:Portatiles_Logicalis

 VLAN Type  Vlan-mode  Encap
 ---- ----- ---------- -------------------------------
 7    enet  CE         vxlan-16777209, vlan-4093
 10   enet  CE         vxlan-16121790
 11   enet  CE         vlan-502         
                                                                                                                                                 
First of all, have in mind that the VLANs have only the local importance on the Switch; they are NOT propagated within the ACI Fabric. Notice the following VLANs in the previous output:
-        VLAN 7: The default infra VLAN. This VLAN has no importance at all. The important part of the output is the column “Encapsulation”, where the VxLAN 16777209 and VLAN 4093 (Default Infrastructure for real) appear. These 2 entities carry the traffic between Spines and the Leafs.
-        VLANs 8, 9, 10 and 11 are also not important for ACI, only for the Leafs. This means that on the Leaf Ports there is a “Switchport access VLAN 8” command configured. The important parts are the VLANs 501 and 502, which carry the traffic within the ACI Fabric.
If you focus on how the local leaves VLANs are named, you will figure out the following structure: Tenant -> ANP -> EPG. This is done by the ACI, t give you a bettwe preview of what these local VLANs are for.

5. ANP and 6. Contracts will not be explained at this moment.

7. Virtual Machine Manager Integration
Virtual Machine Manager Domain or VMM Domain - Groups VM controllers with similar networking policy requirements. For example, the VM controllers can share VLAN or Virtual Extensible Local Area Network (VXLAN) space and application endpoint groups (EPGs).
The APIC communicates with the controller to publish network configurations such as port groups that are then applied to the virtual workloads.
Note: A single VMM domain can contain multiple instances of VM controllers, but they must be from the same vendor (for example, from VMware or from Microsoft).
The objective here is to create a VMM Domain. Upon creating the VMM domain, APIC will populate the datacenter object in vCenter with a virtual distributed switch (VDS).  You need to create a VLAN pool to be associated with the VMM domain. Have in mind that the VLAN Pools configuration is Global to the ACI Fabric because the VLANs apply to physical Leaf Switches, and they are configured at "Fabric-Access Policies-Pools" menu.
Apart from this, you will need to actually create the VMM Domain (VM Networking Menu), and define the Hypervisor IP and credentials and associate the previously created AEP to your VMM Domain. Once you have the VMM Domain created and all the hosts in the new VDS, you need to associate your EPGs with the VMM Domain, in order to add the Endpoints from the Hypervisor to the EPG.

TIP: Don´t forget that you need to add the ESXi hosts to your newly created VDS manually, from vSphere.

8. RBAC  - Works exactly the same like a RBAC (Role Based Access Policy) on any Cisco platform.

9. Layer 2 and 3 External Connectivity
L2 Bridge: Packet forwarding between EP in bridge domain “BD1” and external hosts in VLAN 500 is a L2 bridge.

IMPORTANT: We need one external EPG for each L2 external connection (VLAN).
Trunking multiple VLANs over the same link requires multiple L2 External EPGs, each in a unique BD. Contract required between L2 external EPG EPG and EPG inside ACI fabric

10. Layer 4 to Layer 7 Services/Devices [Service Function Insertion]
There are 3 major steps we need to perform in order to integrate an external L4-7 Service with ACI:
  •        Import the Device package to ACI.
  •        Create the logical devices
  •        Create the concrete devices

The APIC uses northbound APIs for configuring the network and services. You use these APIs to create, delete, and modify a configuration using managed objects. When a service function is inserted in the service graph between applications, traffic from these applications is classified by the APIC and identified using a tag in the overlay network. Service functions use the tag to apply policies to the traffic. For the ASA integration with the APIC, the service function forwards traffic using either routed or transparent firewall operation.

Sunday, June 7, 2015

Quick overview of IPSEC and SSL VPN technologies


Quick overview of IPSEC and SSL VPN technologies
Introduction
This document is regarding the quick look out of two VPN technologies. It covers the difference and strengths of both technologies.
IPSEC:
-      It works on Layer 3 (Network Layer) of OSI Model.
-      Since, it works on Network Layer; it secures all data that travels between two end points without an association to any specific application.
-      Once, it gets connected then the person will be virtually connected to the respective entire network and able to access the entire network
-      It defines how to provide data integrity, authenticity and confidentiality over insecure network
like Internet.
-      It completes its goal through tunneling, Encryption and Authentication.
-      It is complex because the two entities which will communicate via IPSEC have to agree on same security policies which must be  configured on the both end of the devices.
-      A Single IPsec tunnel secures all the communication between the devices regardless of traffic type. It can be TCP, UDP, ICMP etc. or any application like e-mail, client-server, and database.
-      Special purpose software is available for IPsec connections. This can be for PCs, Mobiles, and
PDAs as well as for edge devices like Routers and Firewall.
SSL VPN:
-      It works on Layer 7 (Application Layer) of OSI Model.
-      It is a protocol used for secure web-based communication over the Internet.
-      It uses encryption and authentication to keep communications privatebetween two devices, typically, web server and user machine.
-      Like IPsec, SSL also provides flexibility by providing level of security.
-      Unlike IPSec, SSL helps tosecure one application at a time and eachapplication is supported via web browser.
-      All basic web browser application such as IE or Mozilla supports SSL, by default. But, not all the application supports same so it requires upgrading which is very cost consuming.
-      Above problem can be resolved by purchasing SSL VPN gateway which is deployed at the edge
of the corporate network and serve as a proxy to LAN application such as e-mail, file servers and the other resources.
-      The browser thinks it is directlycommunicating with the application and applicationthinks it is directly communicating with browser.SSL VPN makes it transparent to the either side of the network.


SSL VPN delivers the following three modes of SSL VPNaccess:
•      Clientless—Clientless mode provides secure access to private webresources and will provide accessto web content.This mode is useful for accessing most content that you would expect to access in a web browser, such as Internet access, databases, and online tools that employ a web interface.
•      Thin Client (port-forwarding Java applet)—Thin client mode extends the capability of the cryptographic functions of the webbrowser to enable remote access to TCP-basedapplications such as Post Office Protocol version 3 (POP3), Simple Mail Transfer Protocol (SMTP), Internet Message Accessprotocol (IMAP), Telnet, and Secure Shell (SSH).


•      Tunnel Mode—full tunnel client mode offers extensive application support through its dynamically downloaded Cisco Any Connect VPN Client (next-generation SSL VPN Client) for SSL VPN.Full tunnel client mode delivers a lightweight, centrally configured and easy-to-support SSL VPNtunneling client that provides network layer access to virtually any application.
Strength and Weaknesses:
IPsec‘s key strength lies in its ability to provide a permanent connectionbetween locations. Working at the network layer (layer 3 of the network stack) also makes it application agnostic: Any IP-basedprotocol could be tunneled through it. This makes IPsec an attractive alternative to an expensive leased line or a dedicatedcircuit. It could also serve as a backup link in the event that the primary leased line or dedicated circuitconnectingthe remote site to the central office goes down.
IPsec's application-agnostic designis also its weakness, however.Thoughit provides authentication, authorization and encryption, while basically extending the corporate network to any remote user, it does not have the ability to restrict access to resources at a granular level. Once a tunnel is set up, remote users can typically access any corporate resource as if they were pluggeddirectly into the corporate network. These VPN security concern are exacerbated because having a mobile workforce requires allowing non-managed IT assets like smartphones and home PCs to access corporate resources.These are assets that IT has novisibility into or control over, andthere is no guarantee that these
Devices comply with the level of security that is typically enforced on managed assets.
IPsec is also more involved to maintain. In addition to setting up the appliance to terminate the tunnels, additional configurationand maintenance are requiredto support the remote user population. In situations where corporations use Network Address Translation (NAT), special configuration is required to ensure IPsec plays nicely with the NAT setup.
SSL VPNs, on the other hand, have been designed from the ground up to support remote access. They do not require any special software to be installed. Remote access is provided through a browser-based session using SSL.SSL VPNs also provide an enterprise with the ability to control access at a granular level. Specific authentication and authorization schemes for access to an application can be limited to as particular user population. Built-in logging and auditing capabilities address various compliance requirements. SSL VPNs also have the ability to run host compliance checks on the remote assetsconnecting to the enterprise to validate they are configured withthe appropriate security software and have the latest patches installed.
This does not meanSSL VPNs are the panacea to all of IPsec’s weaknesses. If a remote site requires analways-onlink to the main office, SSL VPN would not be the solution. IPsec, being application agnostic, can support a number of legacy protocols andtraditional client/server applications with minimal effort.This is not the case withSSL VPNs, which have been built aroundWeb-basedapplications. Many SSLVPNs getaround this weakness by installing a Java or ActiveX-based agent on the remote asset. This installation is typically achieved seamlessly after the remote asset has successfully authenticated tothe SSL VPN appliance, though it should be noted that both ActiveX and Java come withtheir own security weaknesses that attackers commonly seek to exploit.
IPSEC or SSL VPN:
Each VPN method has its place in an enterprise. Ideally, as SSL and IPsec VPNs serve different purposes and complement each other, they should both be implemented. IPsec should be leveragedin situations where an always-on connection toremote office locations or partners/vendors is required. In these instances, granular access control limitations and missing host-check capabilities should be augmented with aNetwork Access Control (NAC) system, whichcan ensure only approved remote hosts are allowed to connect to the enterprise. Enterprises shouldleverage SSL VPNs primarily as a remote access method for the mobile workforce where granular access control capabilities, auditing and logging, and security policy enforcement are crucial. But, regardless of your VPNchoice or specific needs, remember that a VPN must notonly be updated, tested and monitored for performance, but also employedas part of a defense-in-depthstrategy that utilizes comprehensive policies and a variety of network security technologies.
Related Information

Tuesday, June 2, 2015

Logging options on the Cisco ASA

Logging options on the Cisco ASA

Introduction
Logging is a critical function of any device in your network, but perhaps even more so on a firewall. Whether you are troubleshooting an issue, following an audit trail or just wanting to know what is going on at any time, being able to view generated logs is highly valuable. This post looks at logging options on the Cisco ASA and discusses some of the things you need to consider.
Tick clock
It’s all very well looking through your logs as individual events but if you want to tie them together, particularly across multiple devices, then you need to ensure that all of your devices have the correct time configured. Nothing says ‘I love you’ more than a time stamp that you can trust. If you use a centralized logging solution, you can filter logs across multiple devices to help determine root cause of issues. You can configure time on the ASA manually by using the following commands:
1
2
3
ASA#clock set 12:23:00 JUN 02 2015
ASA#clock timezone GMT 0 3
ASA#clock summer-time BST recurring last Mon jun 2:00 last Sun Oct 2:00
The above lines configure the time, the time zone relative to UTC and the daylight savings time settings respectively. There is a battery on the motherboard of the ASA that will keep the time should the device lose power or be rebooted. However, locally configured time can drift over…time, so what we really want is to use a trusted external time source that all devices synchronize against and this is where NTP comes in.

1
2
3
4
ASA(config)#ntp authenticate
ASA(config)#ntp authentication-key 1 md5 fred
ASA(config)#ntp trusted-key 1
ASA(config)#ntp server 192.168.1.11 key 1 source inside prefer
Lines 1-2 above dictate that we should be using authentication with NTP for added security and gives a key to use. Line 3 is required to advise the ASA that this key is trusted. Line 4 tells us which server to use, which interface it can be found on and which authentication key to use. It also tells the ASA to prefer this time source over other NTP servers of the same judged accuracy based on what stratum they are in. You should configure at least two NTP servers for redundancy. In the event that all servers are unavailable for an extended period, the ASA can fall back to using the local clock. NTP is a Jekyll and Hyde protocol. It can be as simple to understand as the last section or you can dive deep in to its bowels and be lost forever.
Log destination
Logs can be sent to several destinations but before I list them, it should be noted that logs come from two key sources, system events and network events. System events include things like CPU errors, network events include packets being denied on a certain interface. Both types of messages are dealt with by the logging subsystem and are then potentially filtered prior to being sent to one of the following destinations:
§  Console – logs sent here can be viewed in real time when you are connected to the serial port. As this causes CPU interrupts for each message, you need to be careful when enabling this
§  ASDM – logs can be viewed in the ASDM GUI. From here, you can quickly build filters, colour code the logs by severity and save the log as a local text file to be dealt with later or simply archived
§  Monitor – logs to a Telnet or SSH session. But you don’t still use Telnet for management do you?!?
§  Buffered – this is the internal memory buffer
§  Host – a remote syslog server
§  SNMP – rather than sending logs remotely using the syslog syntax, you can use SNMP to send a trap
§  Mail – send generated logs via SMTP
§  Flow-export-syslog’s – send event messages via Net Flow v9
Log severity levels
Before I show some examples of how to configure different logging, it’s worth looking at the different severity levels available to us. There are eight in total as per Cisco’s definitions below:
Numeric level
Name
Definition
0
Emergencies
 Extremely critical “system unusable” messages
1
Alerts
Messages that require immediate administrator action
2
Critical
A critical condition
3
Errors
An error message (also the level of many access list deny messages)
4
Warnings
A warning message (also the level of many other access list deny messages)
5
Notifications
A normal but significant condition (such as an interface coming online)
6
Informational
An informational message (such as a session being created or torn down)
7
Debugging
A debug message or detailed accounting message
By selecting a lower severity (with a higher number), you are also opting in to everything with a higher severity e.g. level 4 will not only log all warnings but all errors, critical, alert and emergency logs. Be wary of selecting too low a severity level, particularly on the console. You can quickly bring a device to its knees if it’s getting hammered.
Examples
Here are some examples to show how to get things up and running.
1
2
3
4
5
6
7
8
ASA(config)#logging enable
ASA(config)#logging timestamp
ASA(config)#logging buffer-size 128000
ASA(config)#logging buffered warnings
ASA(config)#logging monitor 4
ASA(config)#logging trap informational
ASA(config)#logging host inside 192.168.1.55
ASA(config)#logging device-id hostname
Line 1 enables logging globally. We then enable timestamps on the log messages, without which it’s difficult to tell when an event occurred. Line 3 configures the size of the local buffer memory. Once this fills up, it is overwritten in a circular fashion. Lines 4 and 5 configure the buffered and monitor destinations previously discussed for the same level, the first using the keyword ‘warnings’ and the second using the equivalent numerical value. Both are interchangeable but will show in various command outputs using the keyword regardless (expect in the logs themselves, where the numerical form will display). Lines 6 and 7 are configured together for remote syslog logging. Line 6 enables the logging at the specified level (in this case informational) and line 7 configures the syslog server IP address and the interface it can be found on.
Line 8 allows various other attributes to be included in each log message. In this case, it will include the hostname but can also include the firewall IP address of a particular interface, the context name (where used) or a specific string. The latter could be useful for using regular expressions for refining logs at a more granular level.
Finally, the show logging command will firstly show the different settings for each logging destination and then the current contents of the local log buffer. Below is an example of its output with just the first log entry for brevity (please note the enabled settings below are not by any means ideal for a production environment, you need to consider what is best for yours):
1
2
3
4
5
6
7
8
9
10
11
12
13
14
15
16
17
ASA#show logging
Syslog logging: enabled
 Facility: 20
 Timestamp logging: enabled
 Standby logging: disabled
 Debug-trace logging: disabled
 Console logging: level debugging, 204220845 messages logged
 Monitor logging: level debugging, 204220844 messages logged
 Buffer logging: level debugging, 204220845 messages logged
 Trap logging: level debugging, facility 20, 204220844 messages logged
  Logging to management 172.16.221.101 errors: 27 dropped: 450
  Logging to management 172.16.221.204
 History logging: level debugging, 204220844 messages logged
 Device ID: disabled
 Mail logging: disabled
 ASDM logging: level informational, 161093061 messages logged
Feb 19 2013 21:41:18: %ASA-4-106023: Deny icmp src outside:10.0.0.1 dst inside:172.16.46.252 (type 3, code 1) by access-group "OUT_IN" [0x0, 0x0]
One thing to note about logging to Telnet\SSH sessions using the monitor destination. Whilst you may have this enabled and will be able to see the messages logged count in the above output rising each time, you may find yourself confused as to why, whilst SSH’d on to your ASA, you aren’t seeing the logs on your screen. To view logs for the current session, assuming they are enabled, you need to type this command in whilst connected:

1
ASA#terminal monitor
and the logs will start appearing according to the severity level you have set. In a move that I can only attribute to Cisco allowing a drunken intern to come up with the command to negate the above one, somebody settled on:
1
ASA#terminal no monitor
Thanks drunken intern guy. To finish off this post, I’ll bundle some other commands together with a brief description:

1
2
3
ASA(config)#logging standby
ASA(config)#logging debug-trace
ASA(config)#logging emblem
If you have a pair of firewalls configured in a failover configuration, you can enter the first command to enable logging on the standby unit also. Just be aware of the increase in traffic if logging externally to the ASA. The second line will additionally send debug messages to any configured syslog servers, which is disabled by default. Again, this can cause a severe increase in traffic, especially if you enable lots of debugs. The last command changes messages to a proprietary Cisco format and to be honest, I don’t think its used much at all.
Summary
Hopefully you will have learnt a couple of extra things you can do with logging from this post but you can dive even deeper and I suggest you do to get the most out of this critical function. For example, you can archive buffered logs to the local flash or to a remote FTP server, you can disable certain messages completely or just filter them from certain destinations. You can also change the default severity of individual messages to better suit your environment. It would require a certain amount of initial work but would be easily repeatable across your estate.
A great place to learn more is to use the ASDM console which, despite me being a CLI fiend on the ASA, comes in to its own when configuring and reviewing logs. Also pay special attention to what level of logging you have for each destination. I’ve only covered a couple of key points on how best to do this (e.g. disable console logging) as what works best depends on your environment. If possible though, try to use a centralised Syslog server and use the ASDM logging due to it’s immediate nature and filtering capabilities.
Thanks

Mirza Mukaram Baig

The Shift - Traditional vs. AI-Based Computing - CPU to GPU

  The Shift - Traditional vs. AI-Based Computing Computing has evolved significantly over the years, with a notable shift from traditional m...